The Ultimate Guide to Airbnb Investment Analysis (2025)
Investing in short-term rentals (STRs) has become one of the most popular real estate strategies of the last decade. Unlike traditional long-term rentals, Airbnb properties can generate 2-3x the monthly revenue. However, they also come with higher operating costs, strict regulations, and variable income.
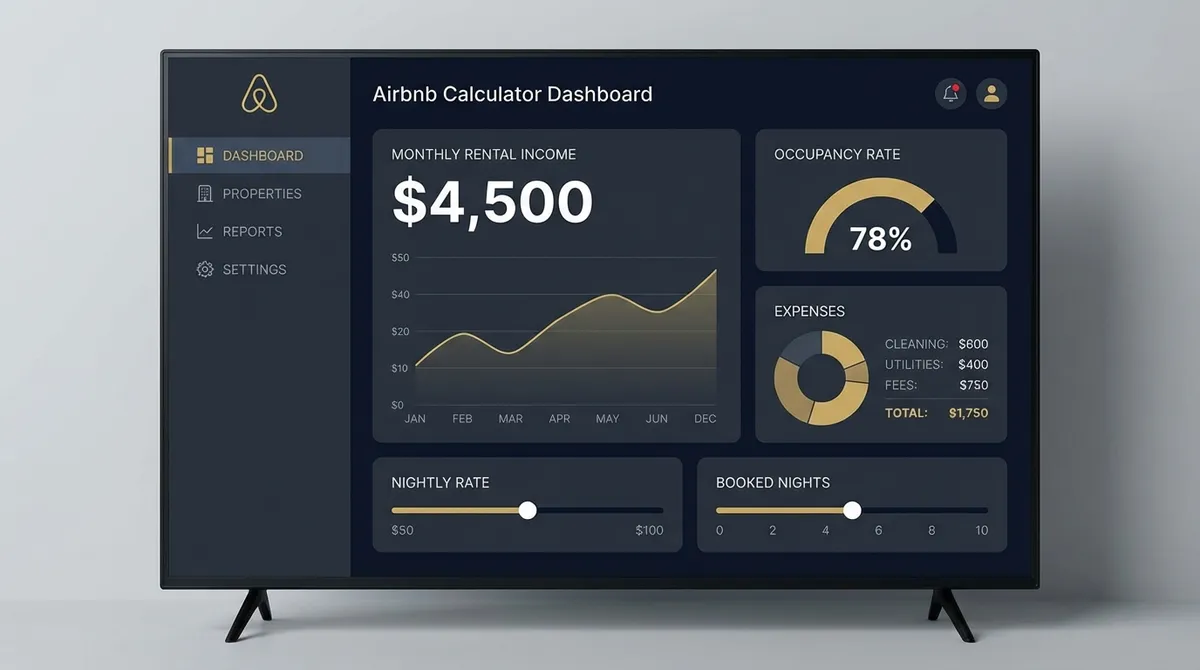
To succeed in 2025, you need more than just a nice property—you need a solid financial plan. This guide scans the essential metrics every host must master: Revenue, Expenses, and ROI. Using our calculator above, you can confidently evaluate whether a property is a goldmine or a money pit.
The Airbnb Revenue Formula
Estimating income isn't guessing; it's math. The core formula for projecting revenue is:
Annual Revenue = (Avg. Nightly Rate × Occupancy Rate) × 365
Average Daily Rate (ADR)
This is the price guests pay per night. It fluctuates wildly based on season, weekends, and local events. Successful hosts use dynamic pricing tools to optimize this daily.
Occupancy Rate
The percentage of days your unit is booked.
• Urban: 70-85%
• Vacation: 50-70% (High seasonality)
Hidden Costs of Hosting
Novice investors often underestimate expenses. In the long-term rental world, expenses might be 15-20% of rent. In the Airbnb world, they are typically 30-45% of gross revenue.
Platform Fees (3-15%)
Airbnb charges hosts 3% (split fee) or 15% (host-only fee). VRBO fees vary. Always factor this into your "Management" or "Platform" expense line.
Turnover Costs
Cleaning is your biggest operational cost. Even if guests pay a cleaning fee, you'll often pay for deep cleans, supply restocking (toilet paper, coffee, soap), and laundry services.
Utilities & Internet
Guests expect fast WiFi and comfortable AC/heating. Unlike long-term tenants, guests don't pay utilities—you do. Budget 20-30% higher than a standard residential home.
Key Metrics: ROI vs. Cap Rate vs. Cash-on-Cash
How do you know if you're making money? Use these three metrics calculated by our tool:
Cash-on-Cash Return
Does your cash work hard?
(Annual Cash Flow / Total Cash Invested) %Target: 10% - 20%+
Cap Rate
Property performance (no mortgage)
(NOI / Property Value) %Target: 6% - 10%
Market Research 101
Before buying, you must validate your numbers. Never trust "pro-forma" data from a seller.
- Check the Regulations: Many cities ban STRs or require expensive permits. Check local zoning laws first.
- Use Data Tools: AirDNA and Rabbu.com provide estimated revenue for specific addresses.
- Spy on Competitors: Look at Airbnb calendars of similar nearby homes. Are they booked for next month? At what price?
Short-Term vs. Long-Term: The Great Debate
Should you rent your property for 12 months (Long-Term) or 2 days (Short-Term)? The answer often depends on your patience, not just the profit.
| Feature | Short-Term (Airbnb) | Long-Term (12mo Lease) |
|---|---|---|
| Revenue Potential | High (2x-3x rent) | Stable, Lower |
| Vacancy Risk | High (Seasonal slumps) | Low (Locked income) |
| Effort Required | High (Hospitality) | Low (Passive) |
| Utilities | Paid by Host | Paid by Tenant |
Airbnb vs. VRBO: Which is Better?
Most successful hosts list on both, but they attract different guests.
Airbnb
- Audience: Everyone (Backpackers to Luxury).
- Stay Type: Often shorter stays, urban apartments, unique stays.
- Fee Structure: Split fee (Host pays ~3%, Guest pays ~14%) is standard.
VRBO
- Audience: Families and Older travelers.
- Stay Type: Longer vacations, entire homes only (no shared rooms).
- Fee Structure: Annual subscription model ($499/yr) for high-volume hosts.
The Tax Side: Keep Your Profits
Airbnb income is taxable, but it also opens the door to massive deductions. You will typically file this on Schedule E (Passive Income) or Schedule C (Active Business) depending on your involvement.
Top Deductions for Hosts:
*Warning: If you rent your primary residence for fewer than 14 days a year, you may not have to report the income at all (The "Augusta Rule"). Consult a CPA.
Mastering Your Airbnb Listing (SEO & Conversion)
Having a great property is only half the battle. You need to sell the experience. The Airbnb algorithm favors listings that convert views into bookings. Here is how to optimize your digital storefront:
1. The Hero Photo
Your first photo determines 80% of your clicks. Do not use a photo of the exterior (unless it is a treehouse or castle). Use a bright, professionally lit shot of the living room or primary view. It must stop the scroll.
2. Title Engineering
Avoid generic titles like "Cozy 2BD Apt". Instead, use the formula: [Adjective] + [Property Type] + [Unique Feature] + [Location Benefit].
Good: "Modern Loft w/ Roof Deck near Convention Center"
3. The Description Hook
The first two sentences are crucial. Do not start with house rules. Start with the feeling. "Wake up to ocean breezes in this sun-drenched coastal retreat..." Sell the dream, then list the amenities.
The "Boring" Verification Checklist
Ignoring local laws can get your listing banned and result in thousands of dollars in fines. Before you list, verify these four pillars of compliance:
1. STR Permit
Most cities now require a Short-Term Rental permit. This often involves a fire inspection and neighbor notification.
2. HOA / Lease Rules
If you are in a condo or apartment, check the bylaws. 90% of standard leases explicitly ban subletting.
3. Proper Insurance
Standard homeowner's insurance denies claims for commercial activity. You need a dedicated STR rider (e.g., Proper Insurance or CBIZ).
4. Occupancy Taxes
Airbnb collects state taxes automatically in many regions, but you may still be responsible for local county usage taxes.
Frequently Asked Questions
What is a good occupancy rate?
It varies heavily by market. In urban centers (NYC, London), 70-85% is standard. In seasonal beach towns, 50-60% might be excellent as long as the nightly rate is high enough during peak season to cover the slow months. Never budget for 100% occupancy; that's unrealistic.
Does the calculator include cleaning fees?
Investing in Airbnb properties requires balancing occupancy rates, nightly prices, and operating costs. While revenue is exciting, it's the expenses that determine your actual profit. By carefully tracking every dollar out, you ensure your "passive" income is actually profitable.venue In = Expense Out) unless you clean it yourself, in which case it is earned income.
How much should I budget for furnishing?
Design sells. Don't cheap out on mattresses or sofas. A rule of thumb is $5,000 - $10,000 per bedroom for a full setup (furniture, linens, kitchenware, decor). This initial "Startup Cost" must be factored into your first-year ROI.
Is "Rental Arbitrage" a good idea?
Rental arbitrage is renting a long-term lease and re-renting it on Airbnb with the landlord's permission. It has lower entry costs (no down payment) but higher risk (lease liability). It works best in high-demand metro areas, but always get the "Subletting Clause" in your lease explicitly approved in writing.
How do I become a Superhost?
Superhost status grants you a badge and higher search ranking. The requirements are strict:
• 4.8+ overall rating
• 10+ completed stays (or 100 nights over 3 bookings)
• <1% cancellation rate
• 90% response rate (reply to messages within 24 hours).
Do I need a property manager?
Self-managing saves you money (managers take 20-30%) but costs time. If you live near the property and have flexible work, self-manage using tools like Hospitable or Guesty. If you live out of state, a good manager or "Co-Host" is often essential to handle emergencies.