Why LTV:CAC Ratio is the Most Important Metric for SaaS Success in 2025
The LTV:CAC ratio (Lifetime Value to Customer Acquisition Cost) is the North Star metric that separates thriving SaaS businesses from those destined for failure. In 2025's competitive landscape, where customer acquisition costs have risen 25% across digital channels and investors demand capital efficiency, understanding and optimizing your LTV:CAC ratio isn't just financial literacy—it's survival. See Wikipedia's guide for more finance basics.
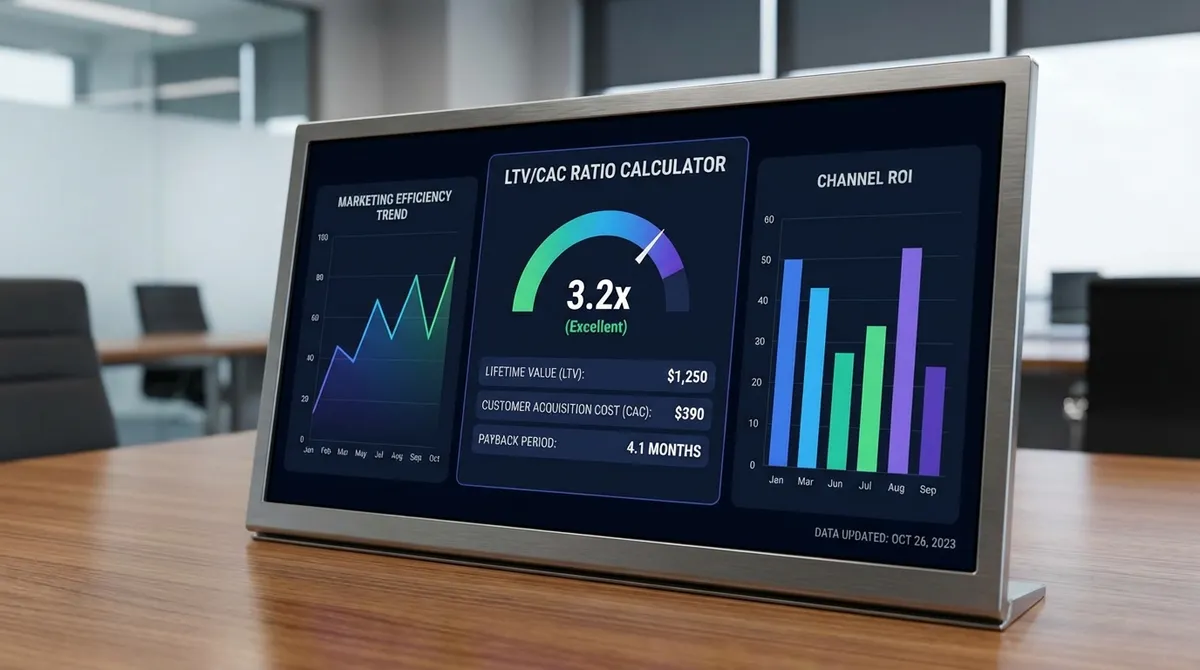
At its essence, the LTV:CAC ratio answers the fundamental business question: For every dollar you spend acquiring customers, how many dollars do you get back over the customer's lifetime? A ratio of 3:1 means you generate three dollars in value for every dollar invested in acquisition—creating a sustainable growth engine that compounds over time. Compare this with your general ROI to see where your marketing dollars work hardest.
Yet despite its importance, 65% of SaaS companies don't accurately track their LTV:CAC ratio, and 40% are unknowingly operating below the 1.0x threshold—meaning they lose money on every new customer. This silent killer of SaaS businesses explains why so many promising startups with impressive growth rates suddenly run out of cash and collapse.
Key Insight: SaaS companies with LTV:CAC ratios above 3.5x grow 2.7x faster than those below 2.0x, while requiring 45% less external capital. In 2025's funding environment, where investors prioritize profitability over growth-at-all-costs, mastering your LTV:CAC ratio determines whether you'll secure the next funding round or face a down round—or worse, shutdown.
Understanding the LTV:CAC Ratio: The Math That Drives SaaS Valuations
The LTV:CAC ratio isn't a standalone metric—it's the product of interconnected business components that together determine your company's financial health. To master this ratio, you must understand the five critical elements that influence it and how they work together to create either a virtuous or vicious cycle.
1. Customer Lifetime Value (LTV) - The Numerator
LTV represents the total profit a customer generates during their entire relationship with your business. The standard formula—LTV = (Average Monthly Revenue × Gross Margin) ÷ Monthly Churn Rate—captures the three levers that drive customer value: how much they pay, how profitably you serve them, and how long they stay.
A customer paying $200/month with 80% gross margin and 5% monthly churn generates $3,200 in lifetime value. This $3,200 represents the maximum you can spend to acquire that customer while breaking even. Smart SaaS companies aim to acquire customers for one-third of their LTV, creating a healthy margin for overhead, profit, and reinvestment.
Pro Tip: Many SaaS businesses miscalculate LTV by using revenue instead of gross margin, overstating true customer value by 20-30%. Always use gross margin to calculate the actual profit available to cover acquisition costs and overhead.
2. Customer Acquisition Cost (CAC) - The Denominator
CAC represents the fully-loaded cost to acquire a new customer, including all sales and marketing expenses. The formula is simple: CAC = Total S&M Expenses ÷ Number of New Customers Acquired. The complexity lies in accurately capturing all costs that contribute to acquisition.
Common mistakes in CAC calculation include excluding sales team salaries, undercounting marketing overhead, ignoring software costs, and failing to account for the time lag between marketing spend and customer acquisition. A company thinking their CAC is $400 might actually be spending $650 when all costs are properly allocated.
2025 Trend: Rising digital advertising costs and increased competition have pushed CAC up 15-25% across most channels. Companies that relied on paid acquisition are seeing their LTV:CAC ratios deteriorate, making organic growth, product-led growth, and customer referrals more critical than ever.
3. The Multiplier Effect: Why Small Improvements Compound
The power of the LTV:CAC ratio lies in how small improvements compound exponentially. A 20% increase in pricing combined with a 10% reduction in churn and a 15% decrease in CAC doesn't just improve your ratio—it can transform it from 2.5x to 4.8x, turning a struggling business into a cash generation machine.
This multiplier effect explains why successful SaaS companies obsess over unit economics. They understand that improving gross margin by 5 percentage points, reducing monthly churn from 6% to 4%, and optimizing CAC through better targeting can collectively double their LTV:CAC ratio without requiring massive strategic shifts.
4. Payback Period: The Cash Flow Constraint
While LTV:CAC ratio measures long-term efficiency, payback period determines short-term survivability. Payback period = CAC ÷ Monthly Contribution Margin reveals how many months it takes to recover your acquisition investment. Even with a healthy 3.5x LTV:CAC ratio, a 24-month payback period can kill a fast-growing startup through cash flow constraints.
The relationship between LTV:CAC and payback period creates strategic tension: you can optimize for long-term value (high LTV:CAC) or short-term cash flow (short payback), but the best businesses excel at both. In 2025, investors expect payback periods under 12 months alongside LTV:CAC ratios above 3.0x.
5. Time Value of Money: The Hidden LTV Killer
Standard LTV calculations ignore the time value of money, but receiving $3,200 over 20 months is significantly less valuable than receiving it today. Sophisticated SaaS companies apply discount rates (typically 10-15% annually) to future cash flows, reducing reported LTV by 15-25% but creating more realistic acquisition spending limits.
This discounting effect means your true LTV:CAC ratio might be 20-30% lower than simple calculations suggest. Companies that ignore time value of money often over-invest in acquisition, creating hidden fragility that appears during market downturns or funding crunches.
Real-World Example: How DataFlow Achieved a 5.5x LTV:CAC Ratio and Dominated Their Market
DataFlow, a data integration platform for mid-market companies, demonstrates how mastering LTV:CAC ratio creates competitive moats. Starting in 2021 with concerning unit economics, they systematically optimized each component to achieve a 5.5x ratio by 2024, fueling 300% annual growth while maintaining profitability.
2021: The Struggling Foundation
• ARPA: $150/month
• Gross Margin: 60% ($90/mo contribution)
• Monthly Churn: 5% (20-month lifetime)
• CAC: $1,500
• LTV: $1,800 ($90 × 20)
• LTV:CAC Ratio: 1.2x
• Payback Period: 16.7 months
• Status: Unsustainable
• Pricing too low for value delivered
• High CAC due to broad, untargeted ads
• Low margins from inefficient server costs
• Payback period > 12 months draining cash
2022: The Optimization Year
Rather than continuing to burn cash, DataFlow paused aggressive growth to fix their unit economics. First, they implemented value-based pricing, increasing ARPA to $250/month. Second, they optimized infrastructure costs, improving gross margin to 80%.
Third, they narrowed their Ideal Customer Profile (ICP) to specific verticals, reducing CAC from $1,500 to $1,200 through better targeting. Finally, investment in customer success reduced churn from 5% to 3%.
2024 Results: With $250 ARPA, 80% margin ($200/mo), 3% churn (33-month lifetime), and $1,200 CAC, their LTV jumped to $6,600. This created a 5.5x LTV:CAC ratio. Crucially, payback period fell to just 6 months, making growth capital-efficient.
2023-2024: The Scaling Phase
With proven unit economics, DataFlow accelerated growth aggressively. They increased marketing spend by 400% across their now-efficient channels. The strong unit economics meant each dollar invested generated $5.50 in lifetime value, creating a self-funding growth flywheel.
5.5x
LTV:CAC Ratio
$6,600
Customer LTV
6 mo
Payback Period
$18M
ARR (Reached)
The Strategic Lessons
Value-Based Pricing: Charging based on customer value rather than internal costs increased ARPA 50% without hurting conversion rates.
Customer Success Investment: Proactive onboarding and success programs cut churn nearly in half, dramatically increasing LTV.
ICP Concentration: Narrowing their target market improved conversion rates, reduced CAC, and increased average deal size simultaneously.
Common LTV:CAC Mistakes That Crash Promising SaaS Companies
Mistake #1: Using Revenue Instead of Gross Margin
This is the deadliest mistake in SaaS economics. Calculating LTV based on revenue instead of gross margin overstates customer value by 20-40%. A company with $200 ARPA and 60% gross margin doesn't have $3,200 in LTV (at 5% churn)—they have $1,920. This error leads to overspending on acquisition and eventual cash flow crisis.
Mistake #2: Ignoring CAC Payback Period
A SaaS company can have a healthy 3.5x LTV:CAC ratio but still go bankrupt with a 36-month payback period. Long payback periods create cash flow gaps that require constant fundraising. In 2025's funding environment, payback periods over 18 months are increasingly viewed as unsustainable, regardless of LTV:CAC ratio.
Mistake #3: Using Blended CAC Instead of Channel-Specific
Calculating one CAC across all channels masks huge variations. Your enterprise sales team might have $2,000 CAC while self-serve PPC campaigns have $150 CAC. Blending them together at $650 CAC leads to incorrect LTV:CAC analysis and misallocation of marketing budget. Always calculate LTV:CAC by acquisition channel.
Mistake #4: Not Adjusting for Time Value of Money
Receiving $5,000 over 30 months is worth significantly less than receiving $5,000 today. Failing to discount future cash flows overstates LTV by 15-25%. This leads to over-investing in acquisition and creates hidden fragility during market downturns or funding crunches when cash becomes precious.
Mistake #5: Optimizing Ratio Without Understanding Drivers
A SaaS CEO might celebrate a 4.0x LTV:CAC ratio without realizing it's driven by artificially low CAC from early adopter referrals that won't scale. When they accelerate spending, CAC triples and the ratio collapses to 1.3x. Always understand what's driving your ratio and whether those drivers are sustainable at scale.
How to Optimize Your LTV:CAC Ratio: Proven Strategies for Sustainable Growth
Improving your LTV:CAC ratio requires systematic optimization across three dimensions: maximizing customer value, minimizing acquisition costs, and accelerating payback. Here are battle-tested strategies for each area.
Maximizing Customer Lifetime Value (LTV)
💰 Implement Value-Based Pricing
Charge based on the value you deliver, not your costs. If your product saves customers 20 hours/month at $50/hour, that's $1,000/month in value—charging $200-300/month (20-30% of value) is reasonable and can increase ARPA by 50-150%.
📊 Reduce Churn Through Customer Success
Proactive customer success programs can reduce monthly churn by 30-50%. Implement onboarding workflows, usage monitoring, regular check-ins, and early intervention systems for at-risk customers.
🎯 Expand Revenue from Existing Customers
Design pricing that grows with customer usage—API calls, seats, data volume, or feature tiers. Companies with 20%+ revenue from expansions see 50% higher net dollar retention and stronger LTV:CAC ratios.
🏗️ Improve Gross Margins
Optimize infrastructure costs, automate support, and improve operational efficiency. Each 5 percentage point improvement in gross margin directly increases LTV by the same percentage—a powerful lever for improving your ratio.
Minimizing Customer Acquisition Cost (CAC)
🎯 Focus on High-Intent Channels
Shift budget from broad awareness to high-intent channels—review sites, search ads for high-value keywords, intent-based content marketing. This can reduce CAC by 40-60% while improving lead quality.
📈 Build Organic Growth Engine
Invest in SEO, content marketing, and product-led growth loops. Organic channels have 50-70% lower CAC than paid channels and compound over time, creating sustainable competitive advantages.
🎯 Perfect Your Ideal Customer Profile
Narrow targeting reduces wasted ad spend and improves conversion rates. Companies that tightly define their ICP see 25-40% lower CAC and 30% higher average contract values.
💬 Leverage Customer Referrals
Referred customers have 25-40% lower CAC, 2x higher LTV, and 3x higher conversion rates. Implement a referral program with meaningful incentives for both referrer and referee.
Accelerating Payback Period
💳 Annual Prepayment Discounts
Offer 15-20% discounts for annual prepayment. This improves cash flow, reduces churn, and accelerates payback from 12 months to effectively immediate, dramatically improving capital efficiency.
⚡ Fast-Track Onboarding
Reduce time-to-value from months to weeks through automated onboarding, better documentation, and implementation support. Faster value realization means customers start contributing to CAC recovery sooner.
📈 Front-Loaded Pricing
Structure pricing with implementation fees, setup costs, or higher first-year fees. This front-loaded revenue accelerates payback while aligning with customer value delivery.
🎯 Upsell Early and Often
Design upgrade paths that let customers expand usage within 30-60 days. Early upsells accelerate payback and increase lifetime value—creating wins on both sides of the LTV:CAC equation.
When to Scale: The LTV:CAC Decision Framework
Scaling with poor unit economics is like pouring gasoline on a fire—you accelerate toward failure faster. Use this decision framework to determine when you're truly ready to scale customer acquisition.
Scale-Ready Checklist
LTV:CAC Ratio ≥ 3.0x (Preferably 3.5x+)
This provides healthy margin for overhead, product development, and profit while creating a buffer for CAC increases during scaling.
Payback Period ≤ 12 Months
Shorter payback periods improve cash flow, reduce capital requirements, and create self-funding growth engines that scale without constant fundraising.
Gross Margin ≥ 75%
High gross margins provide substantial profit per customer to fund acquisition, operations, and product development while scaling efficiently.
Monthly Churn ≤ 5%
Low churn indicates strong product-market fit, predictable revenue, and high customer satisfaction—essential for sustainable scaling.
Proven, Scalable Acquisition Channels
You should have 2-3 acquisition channels with predictable CAC and conversion rates that can scale without linear cost increases or quality degradation.
Warning Signs: You're Not Ready to Scale
- • LTV:CAC ratio improves only when you reduce marketing spend (ratio is artificially inflated by low volume)
- • CAC varies wildly month-to-month, indicating unpredictable acquisition channels or poor tracking
- • Most customers come from referrals or partner deals that won't scale with increased spend
- • Churn increases as you acquire customers outside your initial niche (indicating weak product-market fit)
- • Payback period exceeds 18 months, creating dangerous cash flow gaps even with strong LTV:CAC
Golden Rule: If your LTV:CAC ratio is 4.0x+, payback period is under 9 months, and churn is below 4%, you have an exceptional foundation for scaling. These metrics indicate a highly efficient business model where growth accelerates value creation and you can raise capital on favorable terms—or potentially scale without it.
How Investors Evaluate LTV:CAC Ratio in 2025
In 2025's funding environment, LTV:CAC ratio has become the primary metric venture capitalists use to evaluate SaaS businesses. Understanding how investors interpret this ratio helps you position your company for successful fundraising and realistic valuations.
🎯 Seed Stage Expectations
Target: 2.5-3.5x LTV:CAC ratio
At seed stage, investors accept lower ratios but want to see clear path to 3.0x+. Focus: early signs of product-market fit, improving metrics, and understanding unit economics drivers.
📈 Series A Expectations
Target: 3.0-4.5x LTV:CAC ratio
Series A investors expect proven, scalable unit economics with at least 12 months of data. They want to see consistent ratios above 3.0x and improving trajectory.
💰 Series B+ Expectations
Target: 4.0-6.0x LTV:CAC ratio
Growth-stage investors demand exceptional unit economics. They expect ratios above 4.0x, payback under 12 months, and look for cohort analysis showing consistency across customer segments.
🚀 Public Company Benchmarks
Public SaaS: 5.0-8.0x LTV:CAC ratio
Public SaaS companies maintain exceptional ratios through scale advantages. Snowflake reports 6.8x, Datadog achieves 7.2x, and Zoom historically hit 8.5x—demonstrating world-class unit economics.
Red Flags for Investors
- ⚠️ LTV:CAC declining as you scale (indicates unsustainable acquisition strategies)
- ⚠️ Ratio above 5.0x but payback period over 18 months (cash flow concerns)
- ⚠️ Wide variance in LTV:CAC across customer segments (weak ICP definition)
- ⚠️ Using "creative" LTV calculations (investors discount non-standard metrics by 20-30%)
- ⚠️ Low gross margin (<70%) with high LTV:CAC (margin compression risk)
What Investors Want to See
12+ Months of Consistent Data
Show LTV:CAC ratio stability across multiple quarters and customer cohorts.
Improvement Trajectory
Demonstrate how strategic changes (pricing, churn reduction, targeting) improved the ratio over time.
Standard Calculations
Use industry-standard formulas so investors can compare your metrics to benchmarks.
Understanding of Drivers
Explain precisely what's driving your ratio and how you'll improve it further.
Conclusion: Making LTV:CAC Your Growth Compass
The LTV:CAC ratio is more than a financial metric—it's your business model's vital sign. A healthy ratio indicates you're creating genuine value with each customer relationship, building a sustainable foundation for scaling, and operating with capital efficiency that's become essential in 2025's funding environment.
Companies that master their LTV:CAC ratio don't just survive—they thrive. They make data-driven decisions about pricing, product development, customer success, and acquisition strategy. They identify and double down on what works while quickly eliminating what doesn't. They scale with confidence, knowing each new dollar invested in growth generates three to four dollars in return.
Whether you're a startup founder seeking Series A funding, a growth marketer optimizing acquisition spend, or a CFO managing capital allocation, the LTV:CAC ratio provides the clarity to make decisions that create lasting value. Use our calculator monthly to track your progress, identify optimization opportunities, and validate your growth strategies before making major investments.
Remember: a SaaS business with excellent LTV:CAC ratio can survive product stumbles, market shifts, and funding challenges. A business with poor unit economics will fail even in perfect conditions. Make this metric your compass, and you'll build a company positioned for long-term success in any market environment.