What Is Real Estate Cash Flow?
Real estate cash flow is the net income from a property after all expenses and debt service are paid. It is the "profit" you pocket every month. In 2025, cash flow is the primary metric for buy-and-hold investors because it provides passive income and a safety buffer against market downturns.
While appreciation (property value growth) builds long-term wealth, cash flow keeps you in the game. A property with negative cash flow is a liability that drains your bank account, whereas a positive cash flow property is an asset that pays you to own it.
Key Concept: Cash flow is not just "Rent minus Mortgage." It includes vacancy reserves, maintenance funds, property management fees, and capital expenditures (CapEx). Ignoring these "hidden" costs is the #1 reason new investors fail.
How to Calculate Rental Property Cash Flow
The calculation follows a logical waterfall structure. Use this exact formula to evaluate any potential deal:
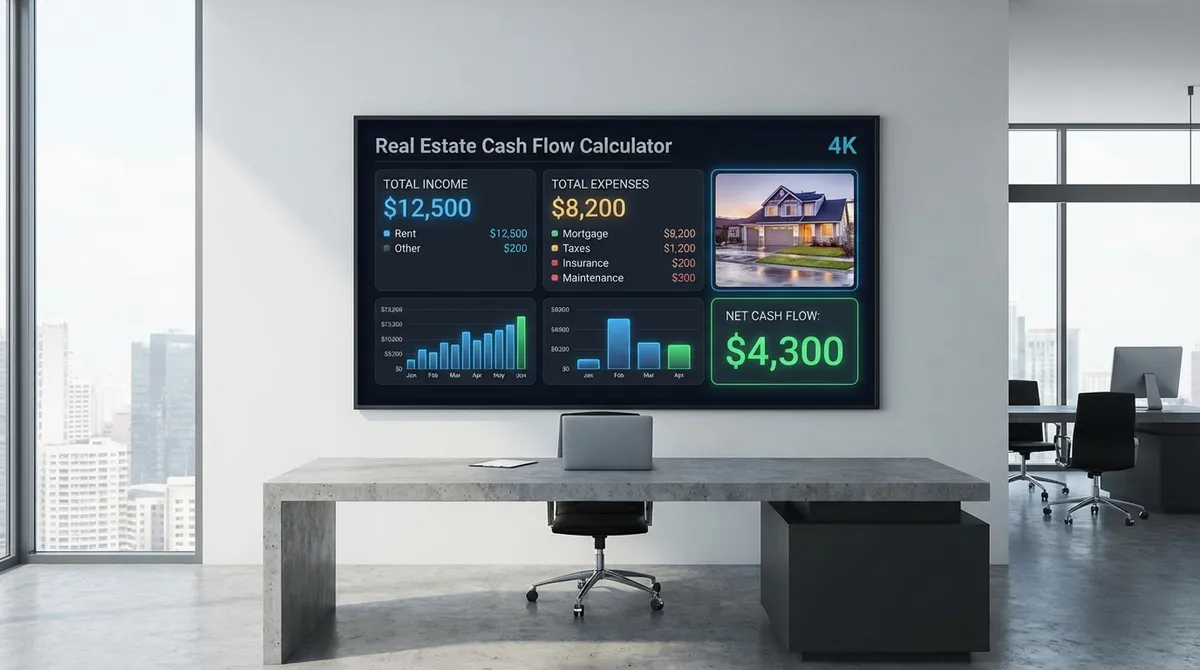
Case Study: The $300k Rental Property
Let's analyze a realistic single-family rental purchase in 2025 using our calculator. We'll assume a $300,000 purchase price with 25% down ($75,000) and a 6.5% interest rate.
Income
- Rent: $2,200
- Parking/Storage: $150
- Vacancy (5%): -$117
- Effective Income: $2,233
Expenses
- Taxes/Ins/HOA: -$400
- Management (8%): -$188
- Maintenance (5%): -$117
- Mortgage (P&I): -$1,422
- Total Outflow: $2,127
*Analysis: While $106 seems low, this property also pays down ~$300/mo in principal and gains ~$750/mo in appreciation (at 3%), totaling over $1,150 in monthly wealth creation.
5 Rules for Positive Cash Flow in 2025
- 1.
The 1% Rule is a Guide, Not a Law. It says monthly rent should be 1% of the purchase price ($2,000 rent for a $200k house). In today's market, hitting 0.7-0.8% is often acceptable if the neighborhood has high appreciation potential.
- 2.
Never Skip Reserves. Always budget 5-10% of rent for maintenance and CapEx (roofs, HVAC). If you don't spend it this month, keep it in a separate account. It will be spent eventually.
- 3.
Calculate Management Fees. Even if you self-manage, include an 8-10% management fee in your calculation. This ensures your deal still works if you decide to hire a property manager later.
- 4.
Don't Bank on Appreciation. Buy for cash flow; let appreciation be the cherry on top. If a deal loses money every month, you are speculating, not investing.
- 5.
Shop Your Mortgage. A 0.5% difference in interest rate can change your cash flow by $100-200/month. Work with an investor-friendly lender.
Pro Tip: Following these professional tips can significantly alter your property's financial trajectory. Small adjustments in income generation and expense reduction accumulate over time, turning a marginally profitable property into a high-performing asset.
Common Metrics Explained
Return on Investment (ROI)
Measures return on your actual invested cash.
NOI (Net Operating Income)
Income after expenses but before mortgage.
The 4 Wealth Generators of Real Estate
New investors often obsess over cash flow ("Can I profit $100/month?"). Seasoned investors look at the complete picture. Real estate pays you in four ways simultaneously:
💰 Cash Flow
The monthly profit after all bills. This is your "passive income" to live on.
📈 Appreciation
The property value grows over time. At 4% annual growth, a $300k house gains $12,000 in Year 1—often more than the cash flow.
🏦 Loan Paydown
Your tenant pays off your debt. Every month, a portion of the rent reduces your principal balance, increasing your equity automatically.
⚖️ Tax Benefits
Depreciation is a "phantom expense" that lowers your taxable income on paper, allowing you to keep more of your cash flow tax-free.
Financing Strategies to Boost Cash Flow
The loan terms you secure can make or break a deal's cash flow. Here are three strategies to structure debt for maximum profitability:
Interest-Only Loans
By paying only interest for the first 5-10 years, you significantly lower monthly payments. This is risky but effective for maximizing cash flow in the early years of ownership.
Buying Points (Rate Buydown)
You can pay an upfront fee ("points") to lower your interest rate permanently. If you plan to hold the property for 10+ years, the monthly savings often outweigh the upfront cost.
House Hacking
Buy a duplex or 4-plex with an FHA loan (3.5% down). Live in one unit and rent the others. This often provides the highest "Cash-on-Cash Return" because your personal housing expense is eliminated or subsidized.
Strategy Shift: Short-Term Rentals (Airbnb) vs. Long-Term
Many investors are tempted by the high gross income of short-term rentals. However, cash flow analysis must be adjusted.
Long-Term (Traditional)
- • Vacancy: 5% (Steady)
- • Management: 8-10%
- • Utilities: Tenant Pays
- • Furniture: None
Short-Term (Airbnb)
- • Vacancy: 30-50% (Volatile)
- • Management: 20-30%
- • Utilities: Owner Pays
- • Furniture: $10k-$20k Upfront
Frequently Asked Questions (FAQ)
What is a "good" cash flow per door?
For a standard single-family home with 20-25% down, many investors target $200 - $300 per month in pure net cash flow. If you can achieve $100/door in a high-appreciation market (like Austin or Denver), that might also be acceptable.
Should I pay off my mortgage to increase cash flow?
Mathematically, usually no. Real estate leverage allows you to control a large asset with little money. If you have $200k cash, buying one house in full yields lower total returns than buying four houses with $50k down payments on each (due to 4x appreciation and 4x loan paydown).
How do I estimate maintenance costs?
A common rule of thumb is to budget 1% of the property value per year for maintenance. For a $300,000 house, expect to spend $3,000 annually (averaged over time) on repairs.
What is the 50% Rule?
The 50% Rule is a quick screening tool. It states that operating expenses (excluding mortgage) will roughly equal 50% of the rent. If a property rents for $2,000, assume expenses are $1,000. If the remaining $1,000 can cover the mortgage and leave profit, it might be a good deal.
Is negative cash flow ever acceptable?
Generally, no. Negative cash flow ("alligator" properties) eats your monthly income. The only exception might be in a hyper-appreciating market where the property value is growing by 10-15% annually, but this is a speculative strategy. Safe investing relies on positive cash flow from Day 1.
Do I count principal paydown as cash flow?
No. Loan principal paydown increases your *net worth* (equity), but it is not *cash in your pocket*. You cannot spend equity at the grocery store. Cash flow is strictly the liquid money remaining after all bills are paid.
How do higher interest rates affect flow?
Significantly. A 2% increase in interest rates can raise your mortgage payment by ~25%. This often wipes out positive cash flow entirely. In high-rate environments, investors must either offer lower purchase prices or put more money down to maintain the same cash flow numbers.
Are HOA fees included in operating expenses?
Yes, Homeowners Association (HOA) fees are a guaranteed operating expense that must be paid regardless of occupancy. They can kill cash flow deals, especially in condos where fees can exceed $300-$500/month. Always verify the HOA fee before making an offer.
Why is "Cash Flow" more important than "Net Income"?
"Net Income" on a tax return often includes non-cash deductions like depreciation, making it look like you made less money than you actually did. "Cash Flow" is the raw truth—it represents the actual checks you can deposit into your personal bank account to buy groceries or reinvest.